Reusable Spectrogram and Verification Web Components
We are excited to announce our new reusable, open source, user interface components that can be embedded into any website. It’s now easier than ever to add spectrograms to your own websites!
What are web components #
A web component is a standardised way to create a reusable part of a website.
In the past, when someone wanted to add a spectrogram to their website, they would have to recreate the spectrogram image, the grid lines, axes, and other interactive elements like playback indicators, from scratch. If the underlying technology used to build the website changed, the work would have to be repeated for a new website. This inefficient process has led to many people repeating the same work. Our team have recreated spectrogram components over four times for different projects!
With the web components standard, and new web browser technologies, we can now make these components once, in a way that will work on every website, and every device, for every project. The standards ensure the longevity and reusability of our work. Additionally, building higher-quality components allows us to invest more time in making them accessible.
The new web components provide graphical components often needed for work in
ecoacoustics or bioacoustics, such as spectrograms,
annotation viewers, and verification grids. You can tinker with a
demonstration spectrogram and the options available using the
spectrogram creator
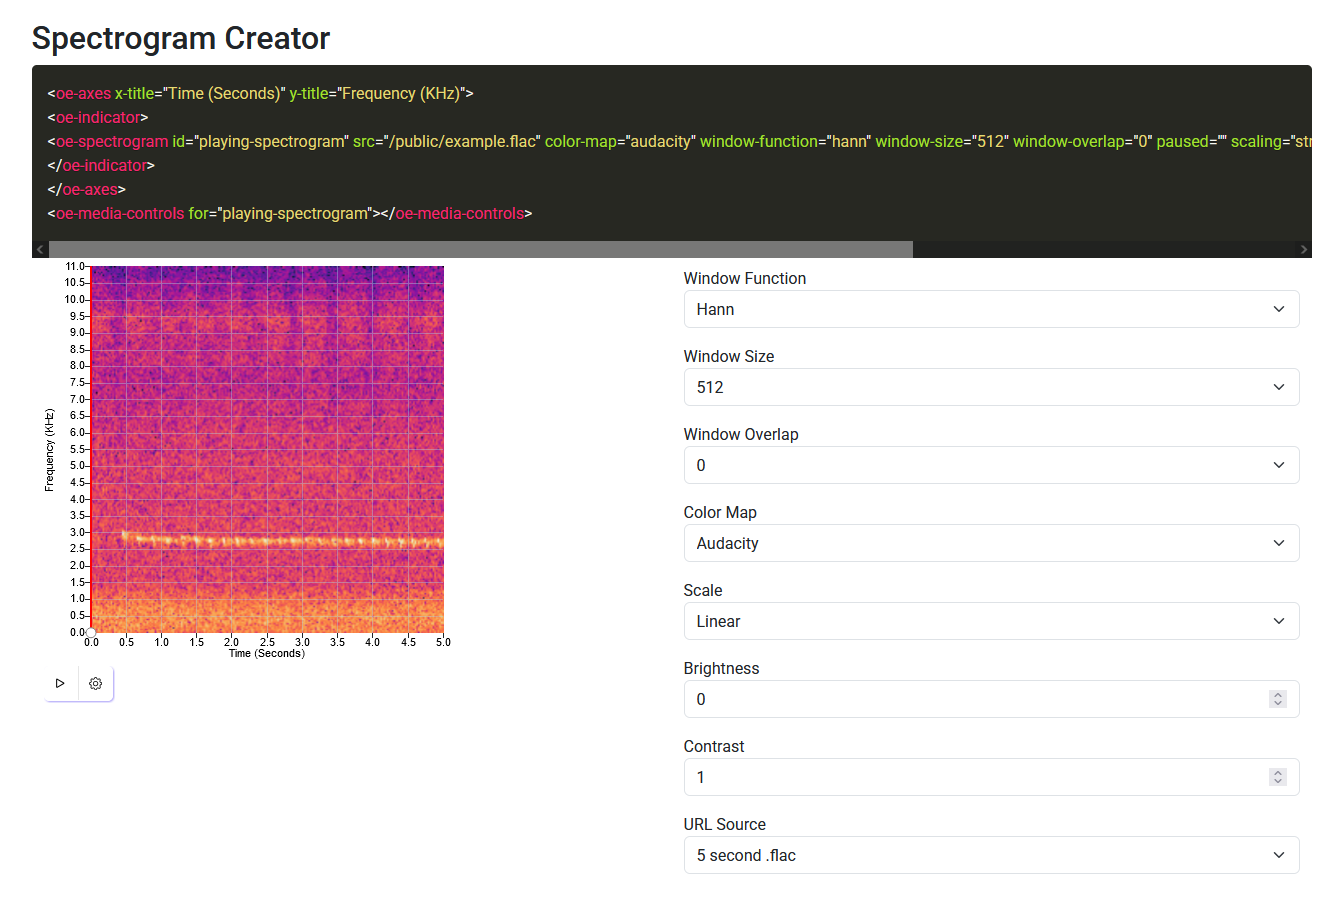
A preview of the spectrogram creator webpage
These components are all open source, so we encourage reuse and contribution! However, the project is still new: bugs exist, and some features are not yet implemented. We appreciate feedback from our community of early testers.
The Spectrogram Component #
The spectrogram component is the cornerstone of this project. It shows a spectrogram of a short audio snippet in your web browser. You don’t need to make the spectrogram image yourself: the spectrogram component will do that for you. There are many options available to customise the spectrogram to your liking.
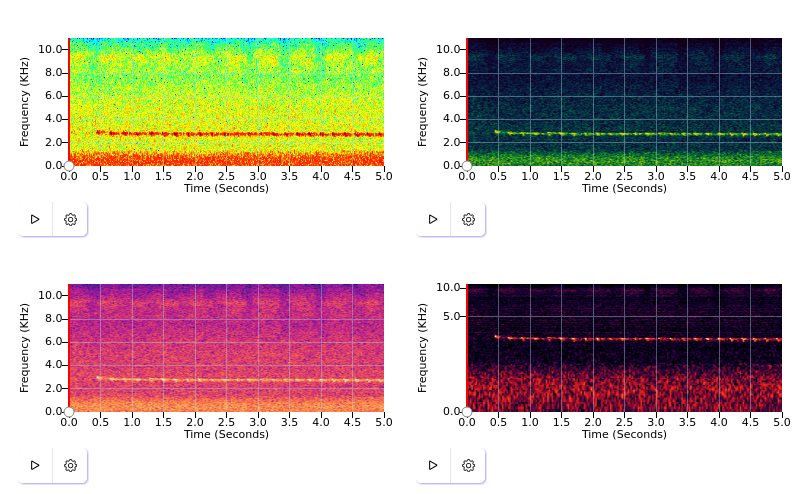
Four variants of spectrograms with different colours, window sizes, and scales
The example above shows the same audio file with various
options that can be easily modified with minimal programming knowledge. The example
shows different color-map options and uses the mel-scale option to
change the spectrogram scale. You can play with this example at Stackblitz: Spectrogram Variants
The Annotation Component #
Adding bounding boxes to label areas of interest is a common requirement in our workflows. This component stacks on top of the spectrogram component.
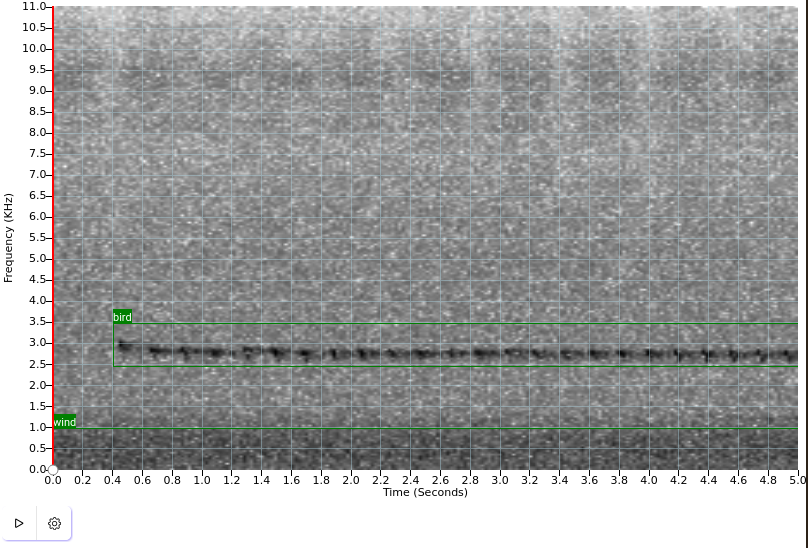
Spectrogram with annotations
The annotation viewer is currently read-only, which is great for showing examples
in blog posts or in libraries of calls. In future work, we’ll make the annotation viewer interactive, allowing
users to add, edit, and remove annotations. You can play with this example at
Stackblitz: Annotation Example
The Verification Grid Component #
A big motivator for creating all of these components was making a verification interface that allows users to verify if tags are correctly applied to an annotation. The most common use case for verification is to validate the output of an automatic recogniser.
The verification grid is customizable. It can show one subject at a time, or (if your screen is large enough) up to 32 subjects simultaneously. It supports verification and classification tasks and has a series of powerful keyboard shortcuts designed to help a user batch verify or classify many subjects quickly.
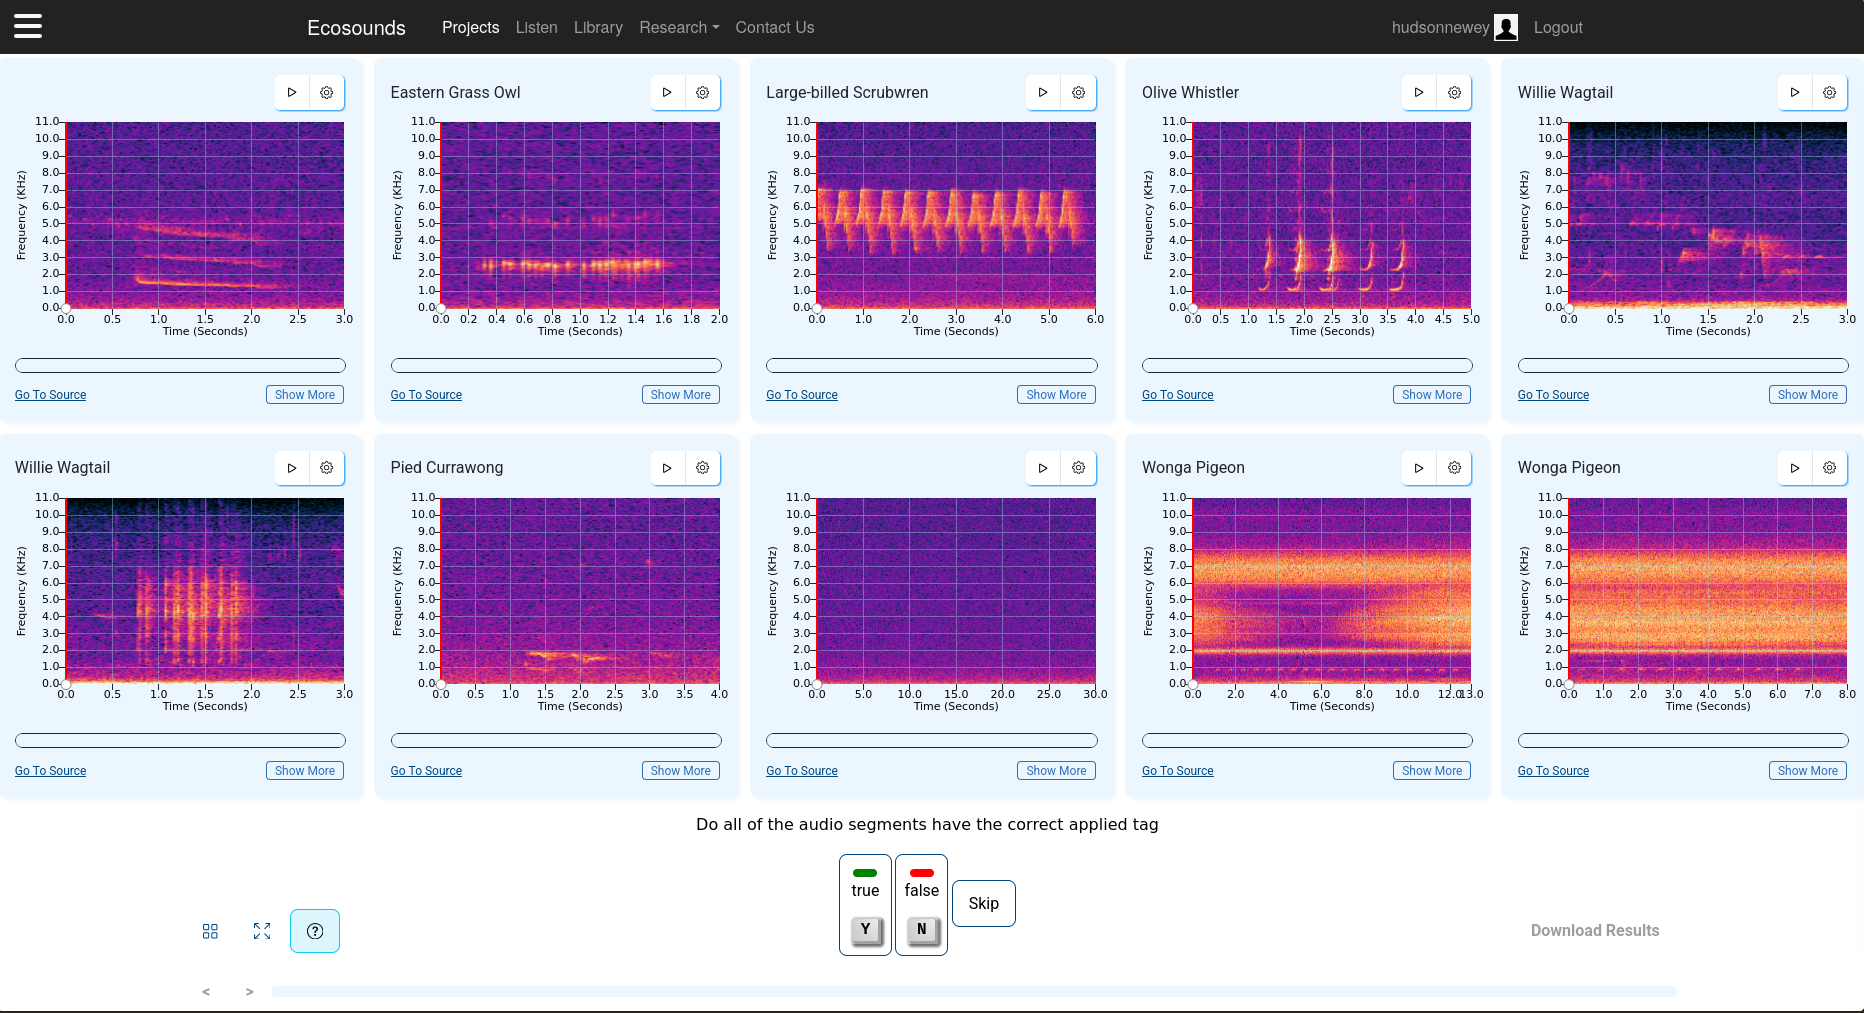
A verification grid deployed on Ecosounds
Annotations shown in the Verification above were sourced from the Cooloola Ecosounds project
under the Creative Commons by Attribution 4.0 license from Phillips, Yvonne (2018) https://doi.org/10.4225/09/5a7297ee4b893
Creating your verification grid also allows easy customisation of the
verification task. For example, if your dataset does not include labeled
species, we support labelling audio segments through the
classificationoe-verification-grid web component. See the
Verification Grid Example
Ecosounds and A2O integration #
We have already used the spectrogram component in some parts of Ecosounds and the A2O. We’ll be rolling out more of these components to the Ecosounds and A2O websites in the coming months.
A “yes”/“no” verification grid has been deployed to all Ecosounds and
Australian Acoustic Observatory (A2O) projects, sites, and points.
This verification grid is now available to all users and welcomes the
collaboration of experts and citizen scientists to verify annotations. As an
example, you can search and verify all annotations with the Tag “Koala” on the A2O
here
Using the web components in your own website #
There are some requirements
<script
    type="module"
    src="https://cdn.jsdelivr.net/npm/@ecoacoustics/web-components/dist/components.js"
></script>

<oe-axes>
    <oe-indicator>
        <oe-spectrogram id="spectrogram" src="/example.flac"></oe-spectrogram>
    </oe-indicator>
</oe-axes>
<oe-media-controls for="spectrogram"></oe-media-controls>
You can experiment with this example in this StackBlitz
Conclusion #
If you find any issues with the web components or have any feedback, please
report them via our
GitHub issue tracker
You can find the web components on GitHub at
ecoacoustics/web-components
This is just the beginning of our web component work. We have many improvements and features planned for the future.
We’re excited to share this work and to see what you create with these new web components!